
After months of monitoring the number of job ads published on LinkedIn in Europe since the beginning of the COVID-19 pandemic, we decided to compare our data with the official unemployment rates provided by Eurostat. We identified 3 categories when it comes to how the number of LinkedIn job ads and the unemployment rates behave in relation to each other.
Note: The division is based on how the indicators reacted for the majority of time, meaning that some months can break the general pattern, but in every case more than 50% of the months were compliant to the given rule. In some cases a neutral reaction occurred: no change (stability) in the unemployment rate.
Category 1: 33.3% → Increase in the unemployment rate = decrease in the number of LinkedIn job ads
The 10 countries that belong to this category show opposite changes in the number of LinkedIn job ads and the unemployment rates: when there was an increase in the unemployment rate, the number of LinkedIn job ads decreased. When there was a decrease (or stability) in the unemployment rate, the number of job ads increased. In other words: more supply of candidates (unemployment) and less demand (less job ads) for candidates.
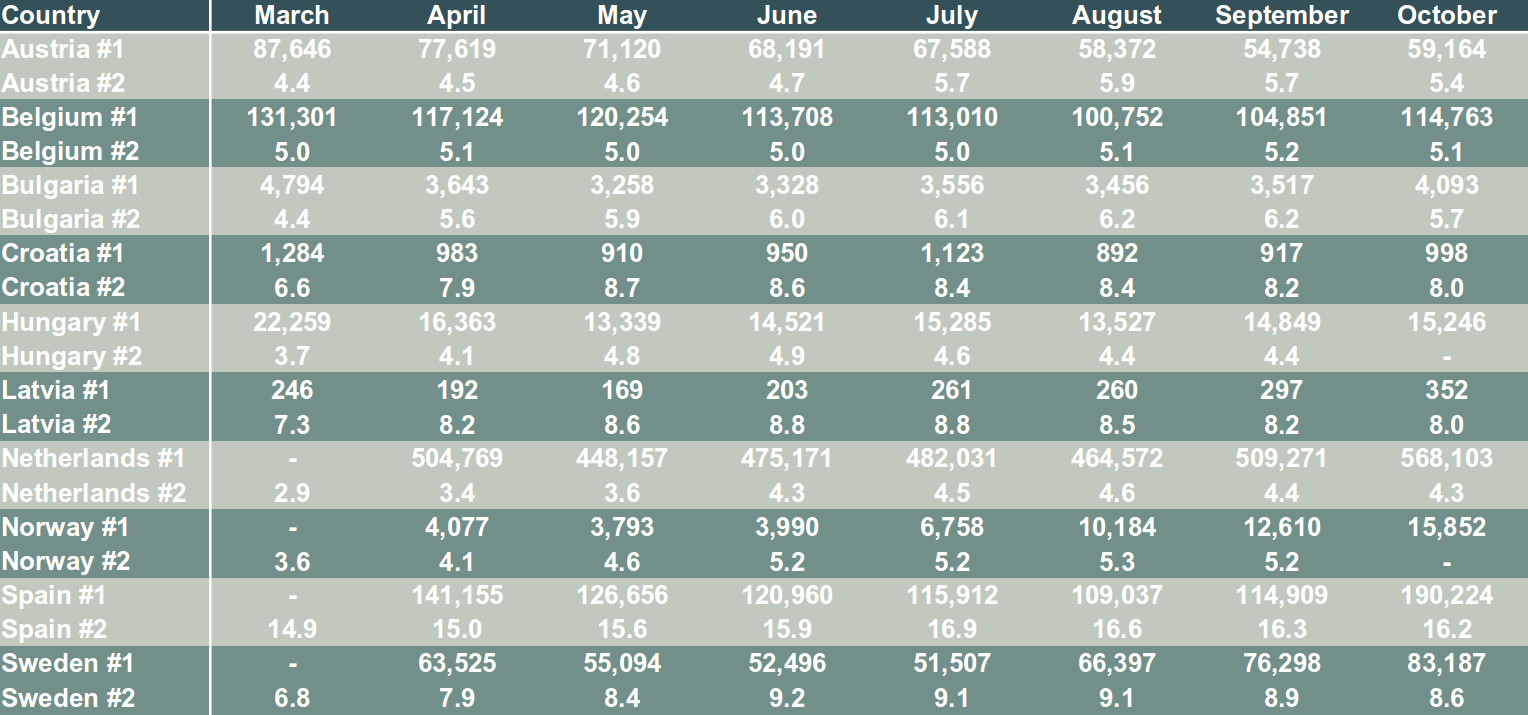
#1 – LinkedIn job ads
#2 – Unemployment rate
Category 2: 33.3% → The number of LinkedIn job ads ~ the unemployment rate
We identified 10 countries that have shown common tendencies and a similar degree of change in the number of LinkedIn job ads and the unemployment rates. This means that in most of the months, the reactions of both indicators were similar: an increase in the number of job ads was reflected as an increase (or stability) in the unemployment rate and vice versa.
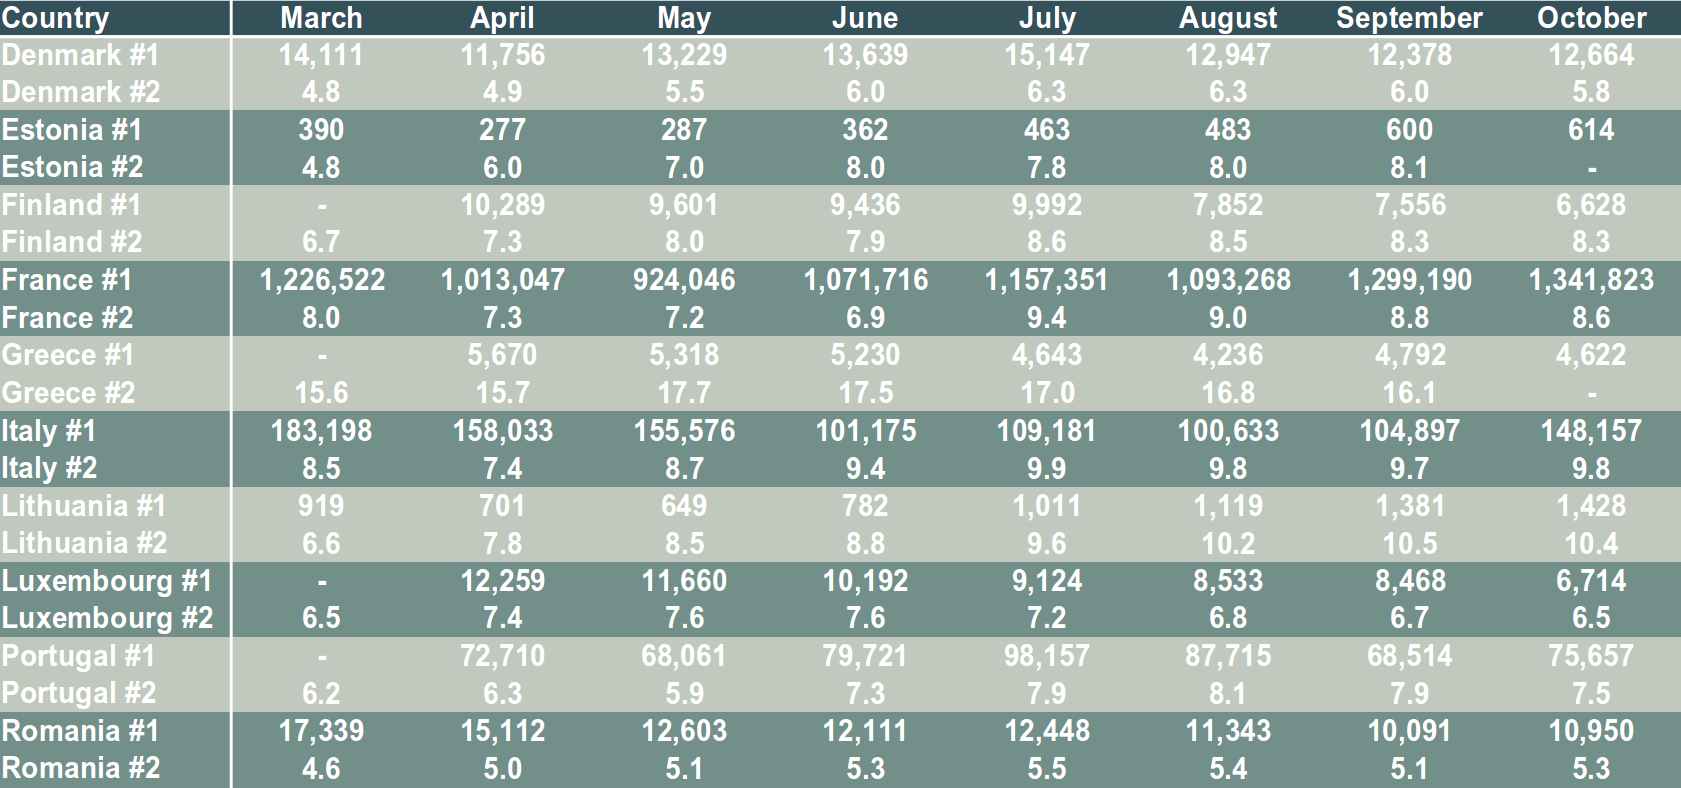
#1 – LinkedIn job ads
#2 – Unemployment rate
Category 3: 33.3% → Stable increase in unemployment rate & unstable number of LinkedIn job ads
Those 10 countries have shown a vast difference in the dynamic and the intensity of monthly changes in the number of LinkedIn job ads and the unemployment rates. While the former would experience frequent fluctuations and sudden shifts in the tendency, the latter would note a steady increase.
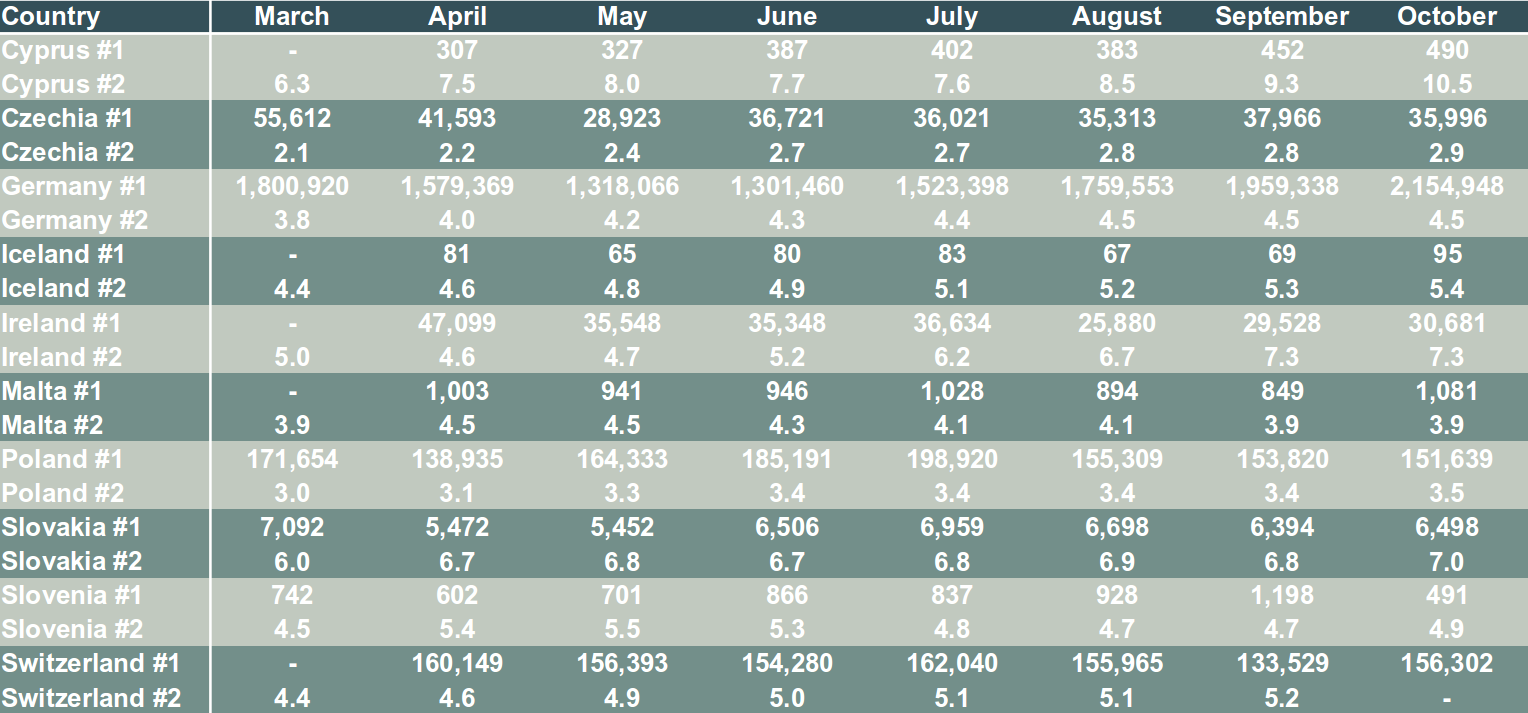
#1 – LinkedIn job ads
#2 – Unemployment rate
In focus: Visegrad
Almost all Visegrad countries belong to Category 3 with stable increase in unemployment rates. The only exception – Hungary, whose number of LinkedIn job ads and unemployment rate results have been opposite, placing the country in Category 1.
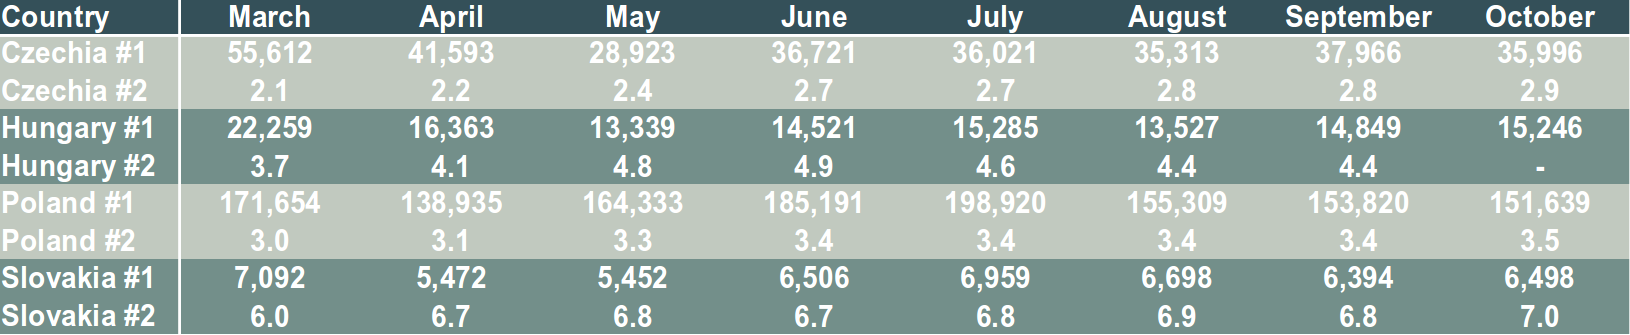
#1 – LinkedIn job ads
#2 – Unemployment rate
In focus: DACH
While Austria’s number of LinkedIn job ads would decrease while its unemployment rate would rise, which made it a member of Category 1, the rest of the DACH countries are in Category 3, meaning that their unemployment rates have been in a stable increase, while the number of LinkedIn job ads has fluctuated frequently.
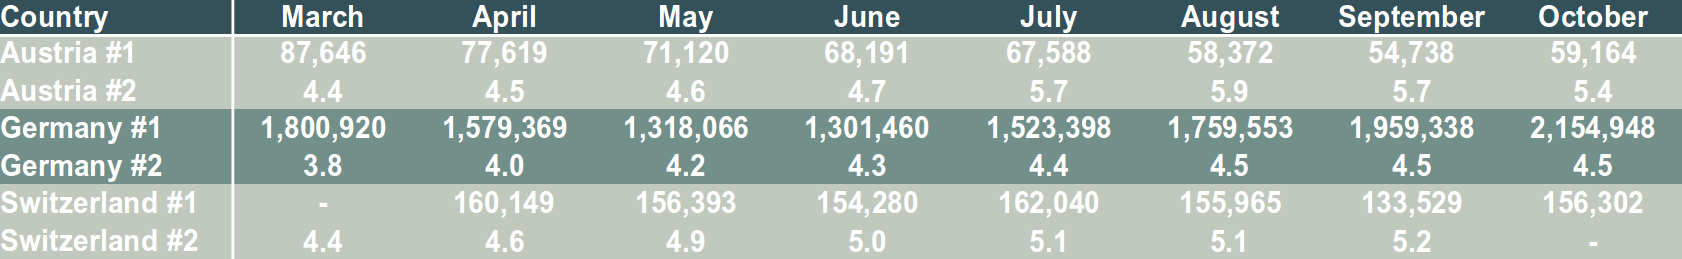
#1 – LinkedIn job ads
#2 – Unemployment rate
Observations
Everyone experiences the economic consequences of COVID-19 differently – how good or bad it really is from a macro-economic perspective can only be described by looking at the actual data – here a couple of examples:
- Spain: while the already high unemployment rate went up from 14.9% to 16.2%, an additional 50 000 job ads were added to LinkedIn
- Lithuania saw the biggest increase in unemployment rate from 6.6% to 10.4%, while the number of job ads increased as well by 55% across 8 months
- Malta & Luxembourg’s October unemployment rates were the same as in March, meaning that they came back to the initial level despite their number of LinkedIn job ads showing an overall downward trend
- Belgium’s unemployment rate was the most stable, never changing by more than 0.1%. At the same time, the number of LinkedIn job ads decreased by 13% across 8 months
Why haven’t we looked at the data from the 4th quarter? Because it’s not available yet. Once it’s released, we’ll prepare an update. But what we were able to do in the meantime is keep tracking tendencies on the demand side (published job ads) during the 4th quarter and the beginning of the year:
- There was 1,467,120 fewer job ads on LinkedIn in Europe in the first week of 2021 than in April 2020
- Looking at the European Union exclusively: it has seen the longest decrease since the beginning of our observations – it has been 6 weeks now that the numbers have been constantly falling. Previous record: 2 weeks
- 87% of the countries saw an increase in the unemployment rate and a decrease in the number of LinkedIn job ads between the first 2 months of our observations
- Between September & October, 83% of the countries noticed an increase in the number of job ads published on LinkedIn
- 93% of the countries noted an overall increase in the unemployment rate
Summarizing, we are not off to a good start – especially from a job search perspective.
If you would like to know more about the COVID-19 influence on the European & global job market, email Bichl.Sandra@CareerAngels.eu and request our special reports:
For daily insights & weekly reports visit LinkedIn.com/Showcase/Market-Signals/ ← click Follow!

